
Paleoclimate reconstruction from data assimilation
Overview
Direct observations of past climate data are brief, especially over remote regions such as Antarctica -- where reliable climate observations span only the satellite era (1979 or later). Proxy records, such as ice cores, corals, and tree rings, can be used to reconstruct past climate states on longer timescales. I use a Bayesian data assimilation method to generate 2D climate reconstructions over the past centuries, using a climate model simulation as the prior and proxy observations. This approach can be used to generate gridded reconstructions of multiple climate states, including temperature, sea level pressure, and wind.
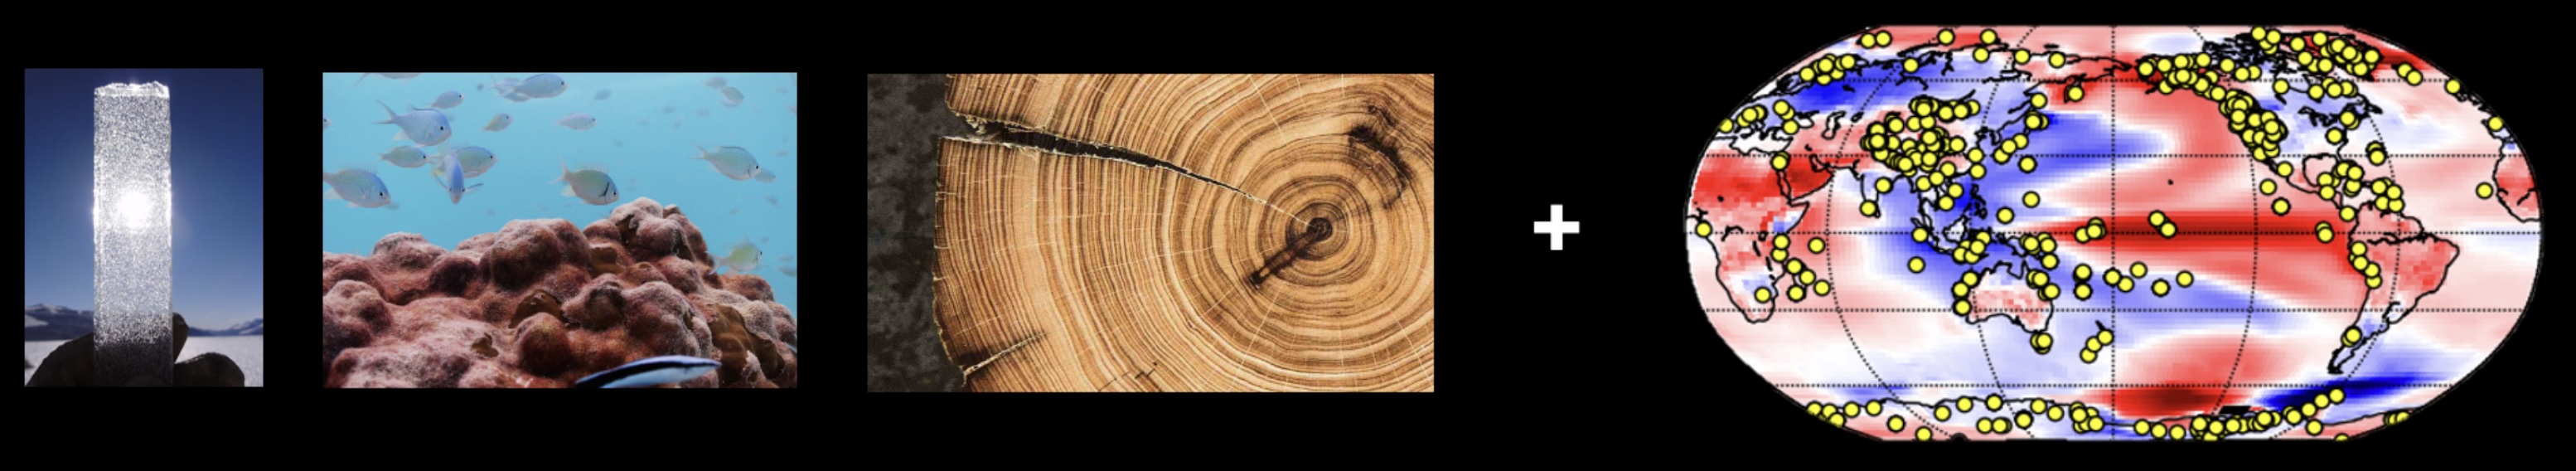 Proxy data are typically used for reconstructing past temperature. However, they are also useful for reconstructing climate at remote regions as long as their climates covary.
The figure on the right shows the covariance between West Antarctic winds and temperatures around the globe, as captured by a climate model. Red and blue regions show strong covariances; yellow dots show proxy locations. If a proxy record lies on a red or blue region, it is useful for reconstructing West Antarctic winds.
Proxy data are typically used for reconstructing past temperature. However, they are also useful for reconstructing climate at remote regions as long as their climates covary.
The figure on the right shows the covariance between West Antarctic winds and temperatures around the globe, as captured by a climate model. Red and blue regions show strong covariances; yellow dots show proxy locations. If a proxy record lies on a red or blue region, it is useful for reconstructing West Antarctic winds.
Data availability
Please reach out if you would like help accessing the data or interpreting the data. I'm happy to answer questions and I'm open to producing new reconstructions with different climate model priors or proxies. Find my contact info on the home page.
- The reconstructions were originally published in O'Connor et al., 2021. They are available for download at Zenodo.
- Reconstructions with single-proxy types assimilated (e.g., corals only, or ice cores only) were published in O'Connor et al., 2023 (available for download here).
- Additional reconstructions using updated climate model priors are in review and will be available upon acceptance.
Associated Studies
- The reconstructions show robust evidence for an Amundsen Sea Low deepening trend in the South Pacific and strengthening circumpolar westerlies with an asymmetric pattern around Antarctica, in contrast to historical climate simulations which show a very annular strengthening of the westerlies. This has major implications for the atmospheric drivers of West Antarctic ice loss: O'Connor et al., 2021
- The reconstructions lie within the ensemble of historical climate model simulations, demonstrating that large internal variability can explain the apparent model-reconstruction mismatch, but also emphasizes that large and irreducible uncertainty associated with climate projections around Antarctica: Holland et al., 2022
- A strong westerly event occurred from 1938 to 1942, coinciding with the estimated initation of glacier retreat in West Antarctica. Comparisons between the reconstructed event and internal climate variability show that the event is likely insufficiently large enough to trigger retreat, which suggests that alternative forcings are needed to explain historical ice loss: O'Connor et al., 2023
- A comprehensive comparison between several proxy-constrained reconstructions and insutrumental-constrained reconstructions of Antarctic sea ice and atmospheric circulation reveals consistencies and inconsistencies that highlight the need to better understand the drivers of historical atmospheric changes in Antarctica: Fogt et al., 2024
- Proxy-constrained reconstructions suggest that historical multi-decadal variability near West Antarctica is driven by both natural tropical and anthropogenic changes: Dalaiden et al., 2024
- Reconstructed atmospheric circulation patterns around Antarctica are consistent with trends in Southern Ocean meltwater that explain the model-data mismatch in Antarctic accumulation changes: Schneider et al., in review
Interactive visualization
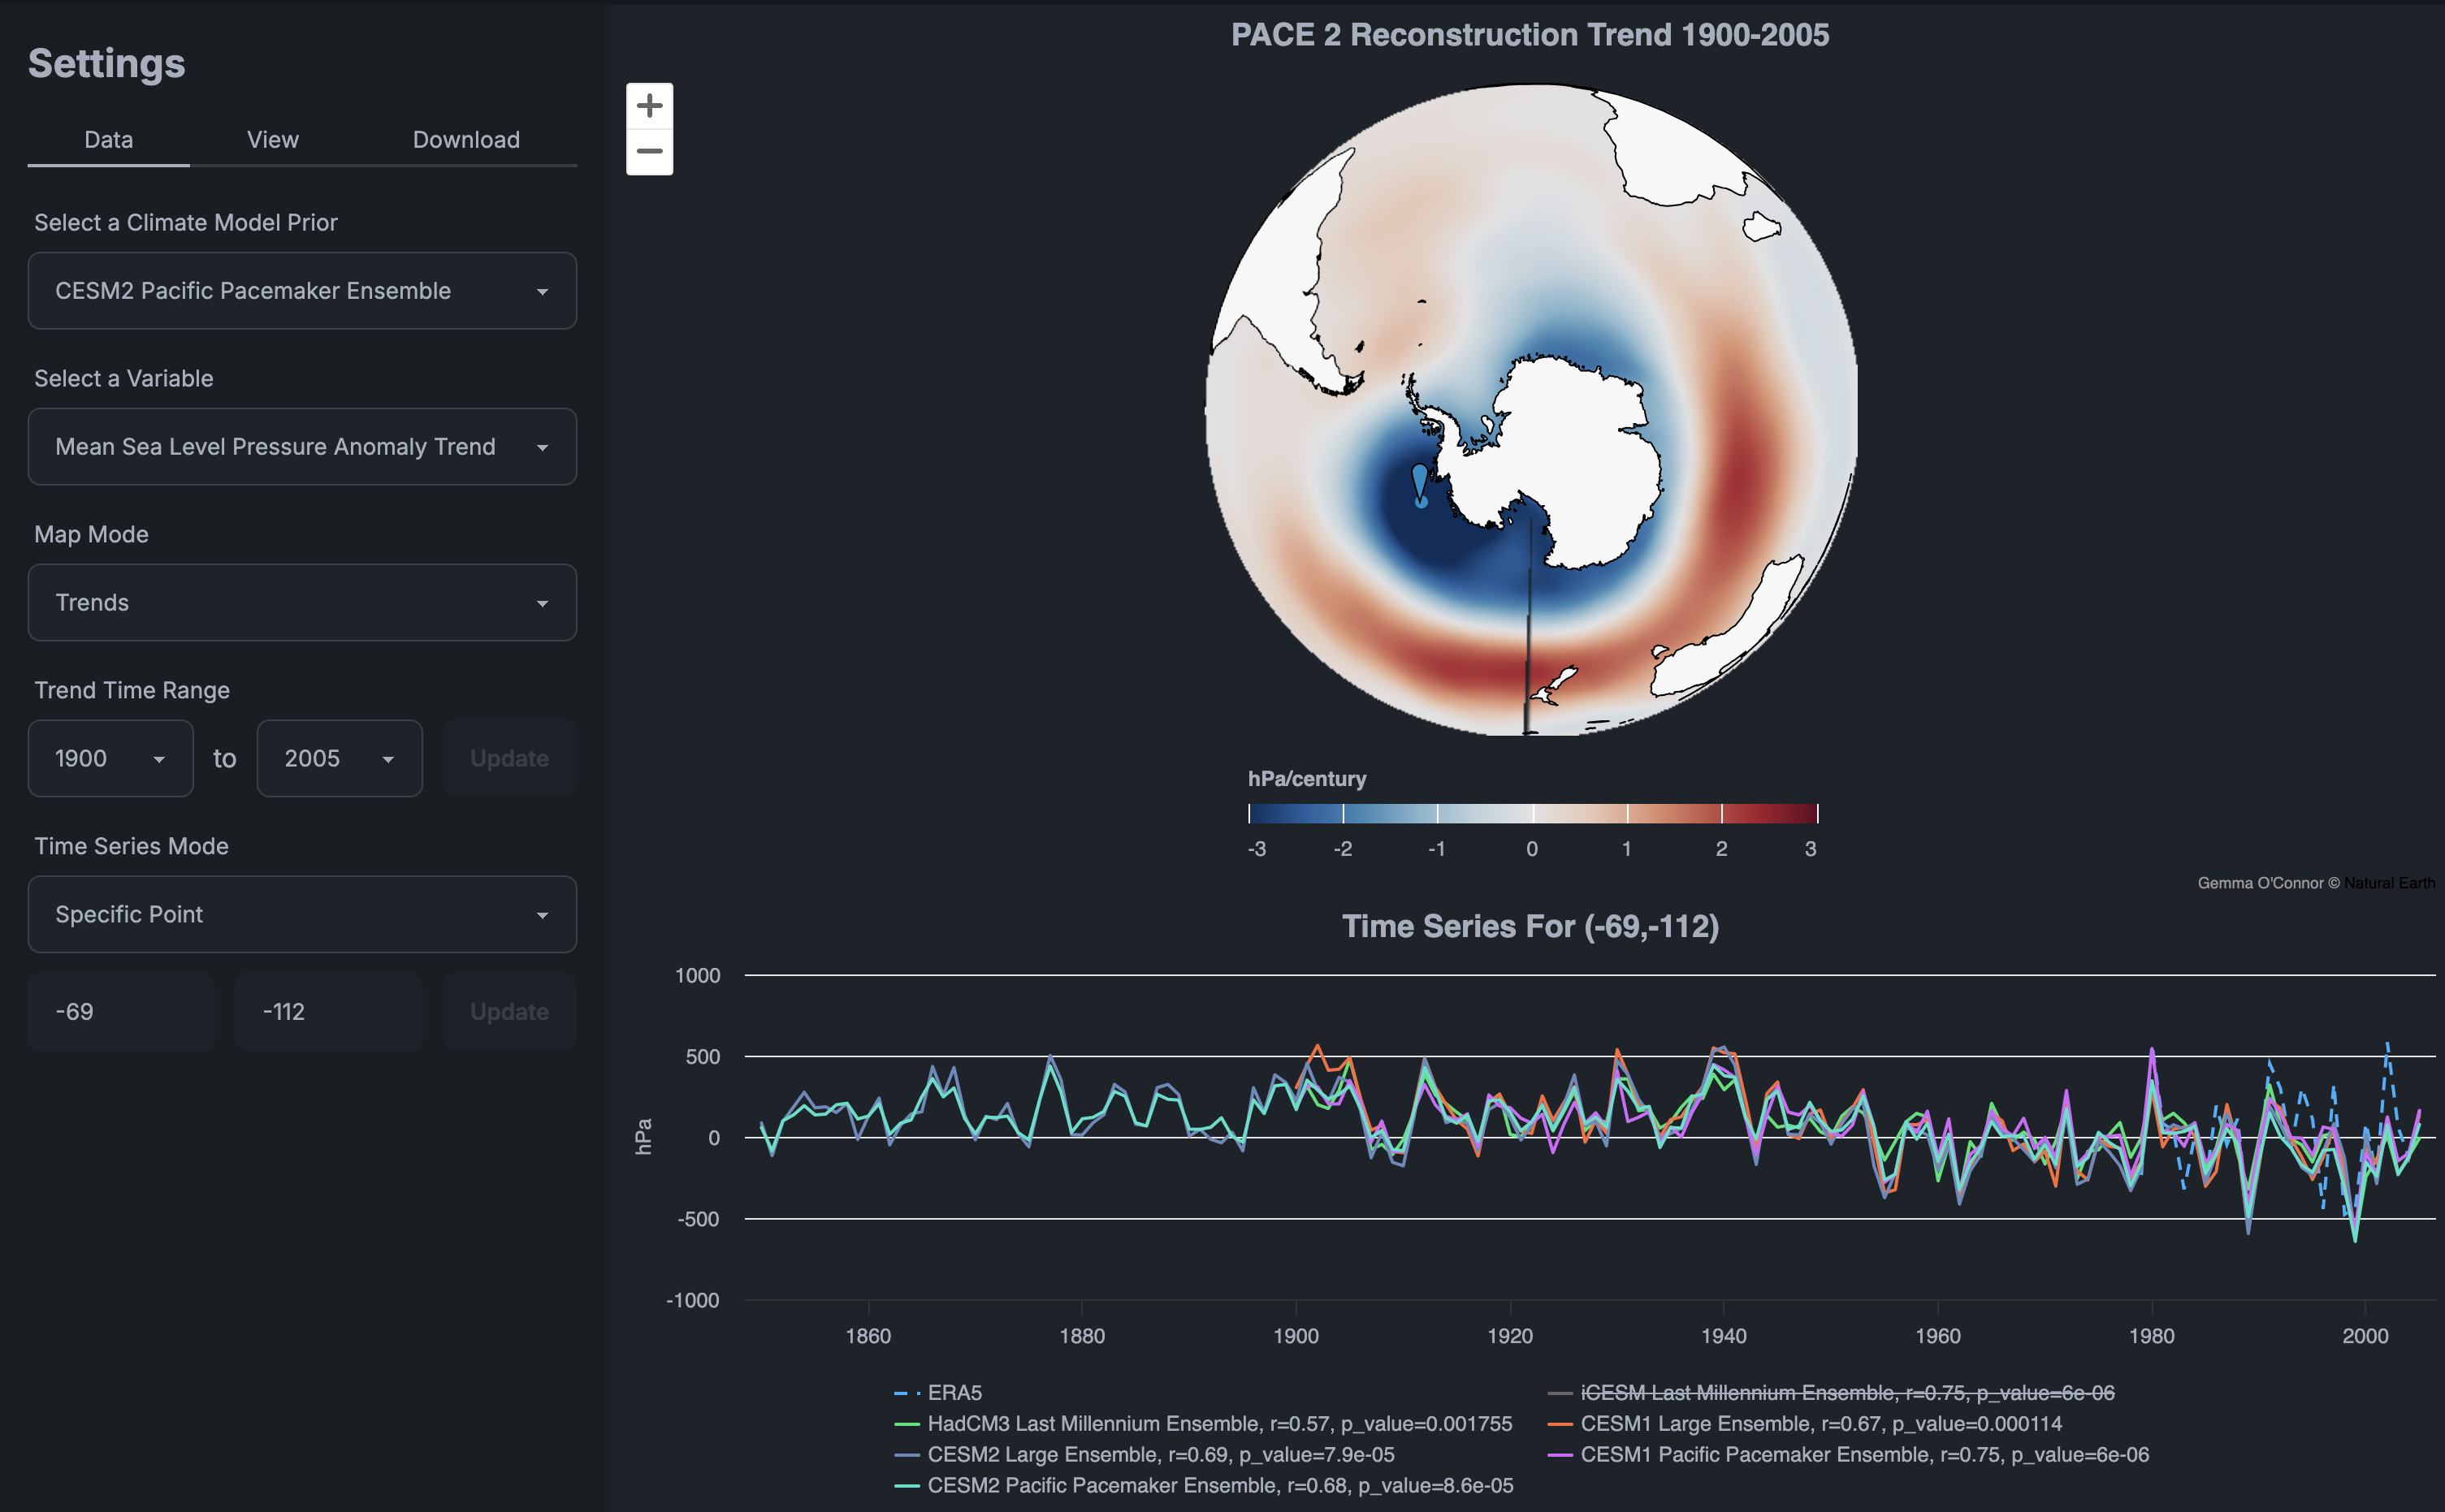
Click on the image above to go to a web application to interact with the reconstructions. Several reconstructions are available, each made with a different climate model prior. The web application was custom built by my undergaduate student, Jordan Tucker, as part of a summer RA position.
Numerical Ocean Modeling near West Antarctica
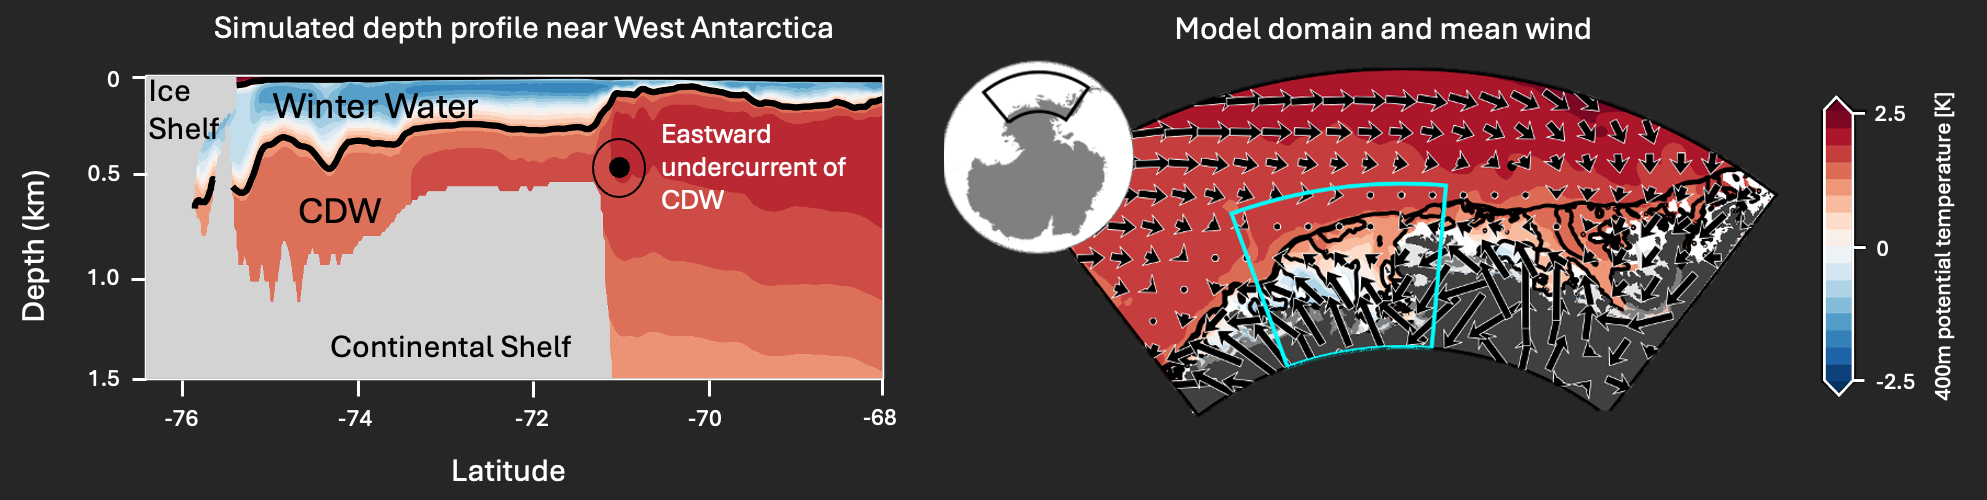
I use high-resolution numerical ocean models to understand the physical mechanisms governing ice loss in West Antarctica, which poses a major threat to sea level rise in the coming decades to centuries. Melting is occurring via complex and coupled wind-ocean-ice processes that are sparsely observed. Ocean models are therefore an invaluable tool for understanding the mechanisms driving these processes in West Antarctica.
In West Antarctica, the most rapid ice loss is occurring via exposure to warm ocean water that lies at depth, called Circumpolar Deep Water (CDW; see left figure below). CDW surrounds Antarctica, just north of the continental shelf. Near West Antarctica, CDW transport toward the glaciers and ice shelves is influenced by several processes, including winds, sea ice, and meltwater inputs. I use a regional domain of the MITgcm model (Nakayama et al., 2018; model domain on right panel) to investigate the influence of different wind patterns on the poleward transport of CDW. The results from these simulations highlight the importance on meridional winds and sea ice (which affect local surface heat fluxes) as a driver of historical glacier retreat (this work is in review).
Reconstructing El Niño activity from corals
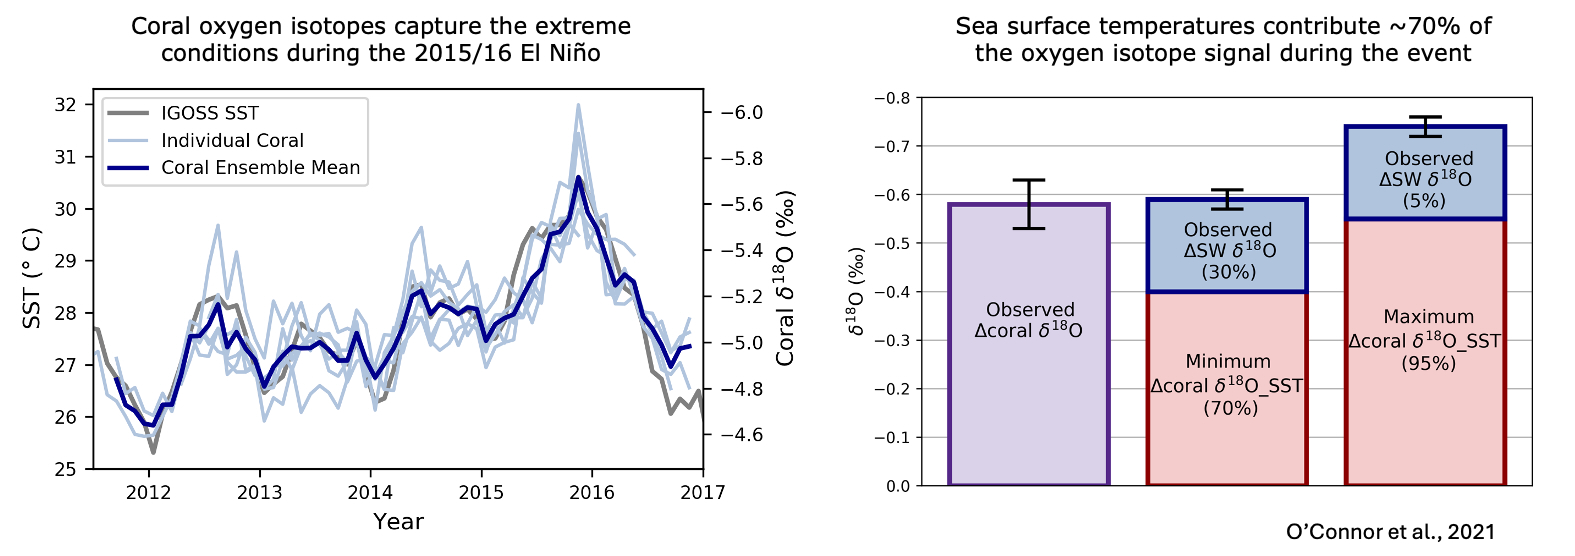
I have also led and collaborated on several studies that use coral oxygen isotope records from the central tropical Pacific, in collaboration with Kim Cobb and colleagues at Georgia Tech during my undergraduate studies. These records provide important constraints for reconstructing past El Niño activity at up to monthly resolution.
In 2016, I participated in a field expedition to Christmas Island, in the central tropical Pacific. We collected several mini coral cores, seawater samples, and in situ logger data. Using these cores and data, we showed that coral oxygen isotopes indeed faithfully recordes the extreme conditions from the 2015/16 El Niño event, which experienced major warming and freshening. By comparing the records with in salinity measurements, we estimate that warming contributes ~70% of the oxygen isotope changes, and freshening contributes the remaining ~30%. These results are published in O'Connor et al., 2021.
Additional Studies
- Corals from the central tropical Pacific indicate El Niño-Southern Oscillation variability is ~25% stonger relative to preindustrial conditions: Grothe et al., 2020
- Coral ensembles reveal warming and freshening trends in the central tropical Pacific over the 20th century: Hitt et al., 2022
- Paired observations reveal large differences in the warming vs. freshening contributions to coral oxygen isotope records for different events due to ocean dynamics: Stevenson et al., 2023
Geophysical constraints from radar surveys in Antarctica
Ice core site selection at Hercules Dome
As part of my doctorate work at the University of Washington, I was fortunate to be a part of a major geophysical compaign at Hercules Dome, Antarctica. We conducted ice penetrating radar surveys to investigate ice sheet dynamics at the site and select an ideal location for drilling the next U.S. deep ice core, which will ideally capture conditions from ~130,000 years ago -- the last time the Earth was as warm as it is today. These conditions will provide insight into whether West Antarctica collapsed during this period, providing context for the natural stability of the ice sheet.
A location in the West Dome region has been selected as a promising location to drill the ice core (Fudge et al., 2022). It appears to have simple and undisrupted layers of ice, meaning that drilling an ice core there would likely allow for a continuous reconstruction of past climate from a single location. It also appears to be frozen at the bedrock, suggesting that the deepest layers of ice have been preserved and that there is potential for getting ice from 130,000 years ago.
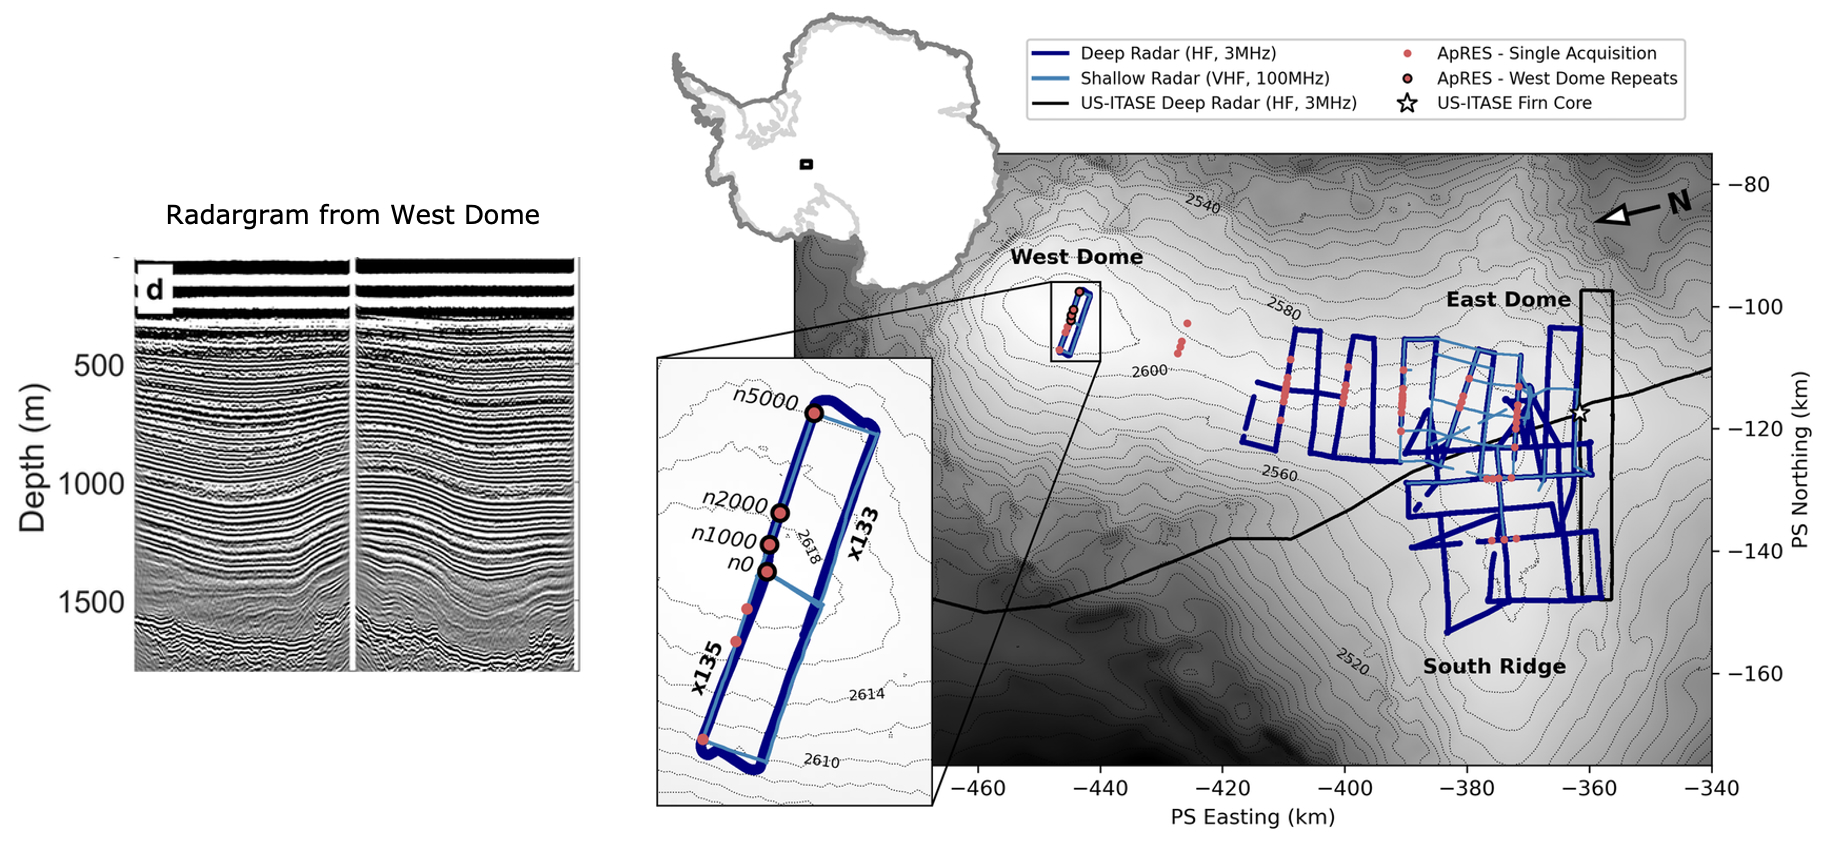
Left: radargram showing smoth ice layers at West Dome, where the ice core will be drilled in the coming years. Right: map of Hercules Dome and the radar surveys completed during our field season. Source: Fudge et al., 2022
Additional Studies
- Hercules Dome radar surveys reveal ancient U-shaped valleys indicative of previous fast-flowing ice, which suggests that this location may have served as a nucleation center for the West Antarctic Ice Sheet: Hoffman et al., 2024
- South Pole radar surveys indicate thawed and stable subglacial lake: Hills et al., 2022
- Learn more about the ongoing Hercule Dome ice core project.